Networking and server monitoring is an essential part of running a successful hosting business. At Vander Host we have refined techniques accumulated over 20 years to give our customers maximum peace of mind that their electronic assets are functioning properly. Great monitoring also means that our engineering staff can be pro-active on top of failures and have a more predicable work-life balance.
The reality is that IT systems need monitoring. Workloads can get out of control, disk space adds up, errand network tasks can inadvertently cause denial of service. The key to success is to monitor just enough, but not too much. To always adjust the system to be tuned at “just the right” performance. It’s a lot like adjusting an engine as you go along. You might ask why not just monitoring everything? The issue too much monitoring could mean a lot of extra unnecessary administration and even strain on system.
So how do we go about it?
The key is our distributed monitoring system which is situated in multiple data centres across the world. We have a number of them in Africa, Europe, USA, and Asia Pacific. We even monitor as far as Tokyo! For an example, see the graph below:
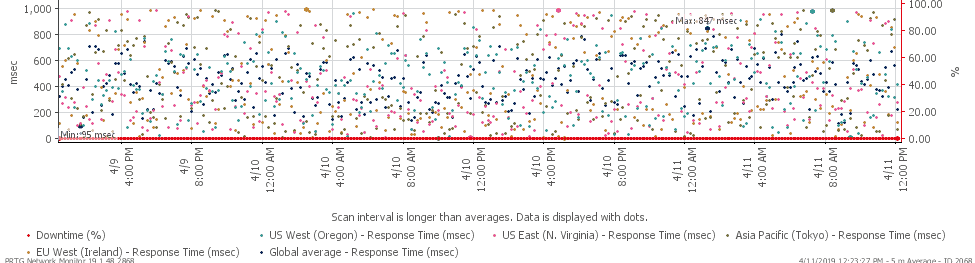
Each dot on this graph represents a test point from the US West, US East, Europe, Africa, and Asia Pacific. By examining this graph we can see weak spots on the internet and pro-actively inform our customers about it, and contact upstream suppliers to have them attend to the issue.
Our course just monitoring response time to a server is just a small part of the picture. We also monitor the servers themselves. By carefully checking CPU, disk space, and local network traffic we get a more comprehensive picture of the situation. We often add triggers on threshold, e.g. disk space, to pro-actively alert our staff and customers that an item needs attention. Check the graph below:
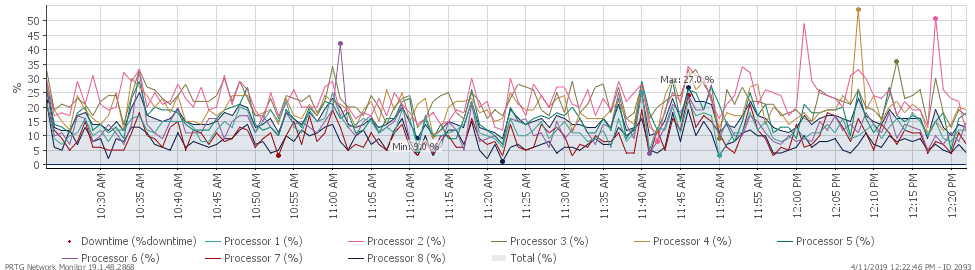
This graph represents an very busy 8 core web server running at full speed. We’ve added trigger to notify us that when the CPU reaches 70%. What’s really cool is our monitoring system is attached to an app so we get instantaneously get notified via push notifications if something is up.
By careful (and transparent) monitoring we are able to provide our customers with some of the highest quality dedicated and virtual private servers (VPSses) in the world.
Want to know more? Reach out to us at by contacting us today and we’ll gladly answer any of your questions.
If you would like to learn more about our server hosting options, check these popular Linux VPS hosting options out.

